What drives climbing ratings?

I’m always on the lookout for the next outdoor climbing trip with routes and areas to explore. What actually makes an outdoor climb a classic? Which features of the rock drive the climber’s experience? To explore this, I analyzed over 115k routes from Mountain Project. In a follow-up blog, I build a personalized recommendation framework that suggests new routes based on your favorite outdoor climbs. The codes can be found here on GitHub.
About the data
Data was downoaded here on kaggle, which includes 116000 routes from Mountain Project. I cleaned and preprocessed the data to select only sport climbs that contain route description and >5 votes. Moreover, the YDS climbing grades were converted into a continuous numerical scale and only climbs with grades >5.8 are selected.
Route descriptions
I applied TF-IDF vectorization to extract text features informative of route style. To reduce noise and select only informative features, I capped feature dimensionality to 5k, removed non-informative common words (e.g., anchors, bolts and meter), included both unigrams and bigrams, and applied frequency thresholds to 20. The resulting 5k feature set was then used to construct a dictionary of climbing attributes, grouping related terms into caegories such as route angles, rock features, hold type, and movement style.
Linear regression
To quantify which route characteristics are associated with higher star ratings, I estimate the following linear regression model:
$\text{Stars}_i = \beta_0 + \beta_1 \text{Grade}_i + \beta_2 \log(\text{Votes}_i) + \sum_k \beta_k \text{Style}_k(i) + \epsilon $.
The coefficients $\beta_k$ measure how the presence of a specific climbing feature in the description of route $i$ (e.g. slab, overhang, pumpy) is associated with the route’s average star rating, for constant grade and popularity.
To prepare for regression analysis, I transformed route descriptions into binary style indicators. I then fit an ordinary least square regression of average star rating on climbing difficulty (Grade), popularity (Votes) and style features (Style) to extract the style coefficients $\beta_k$.
What features drive star rating most?
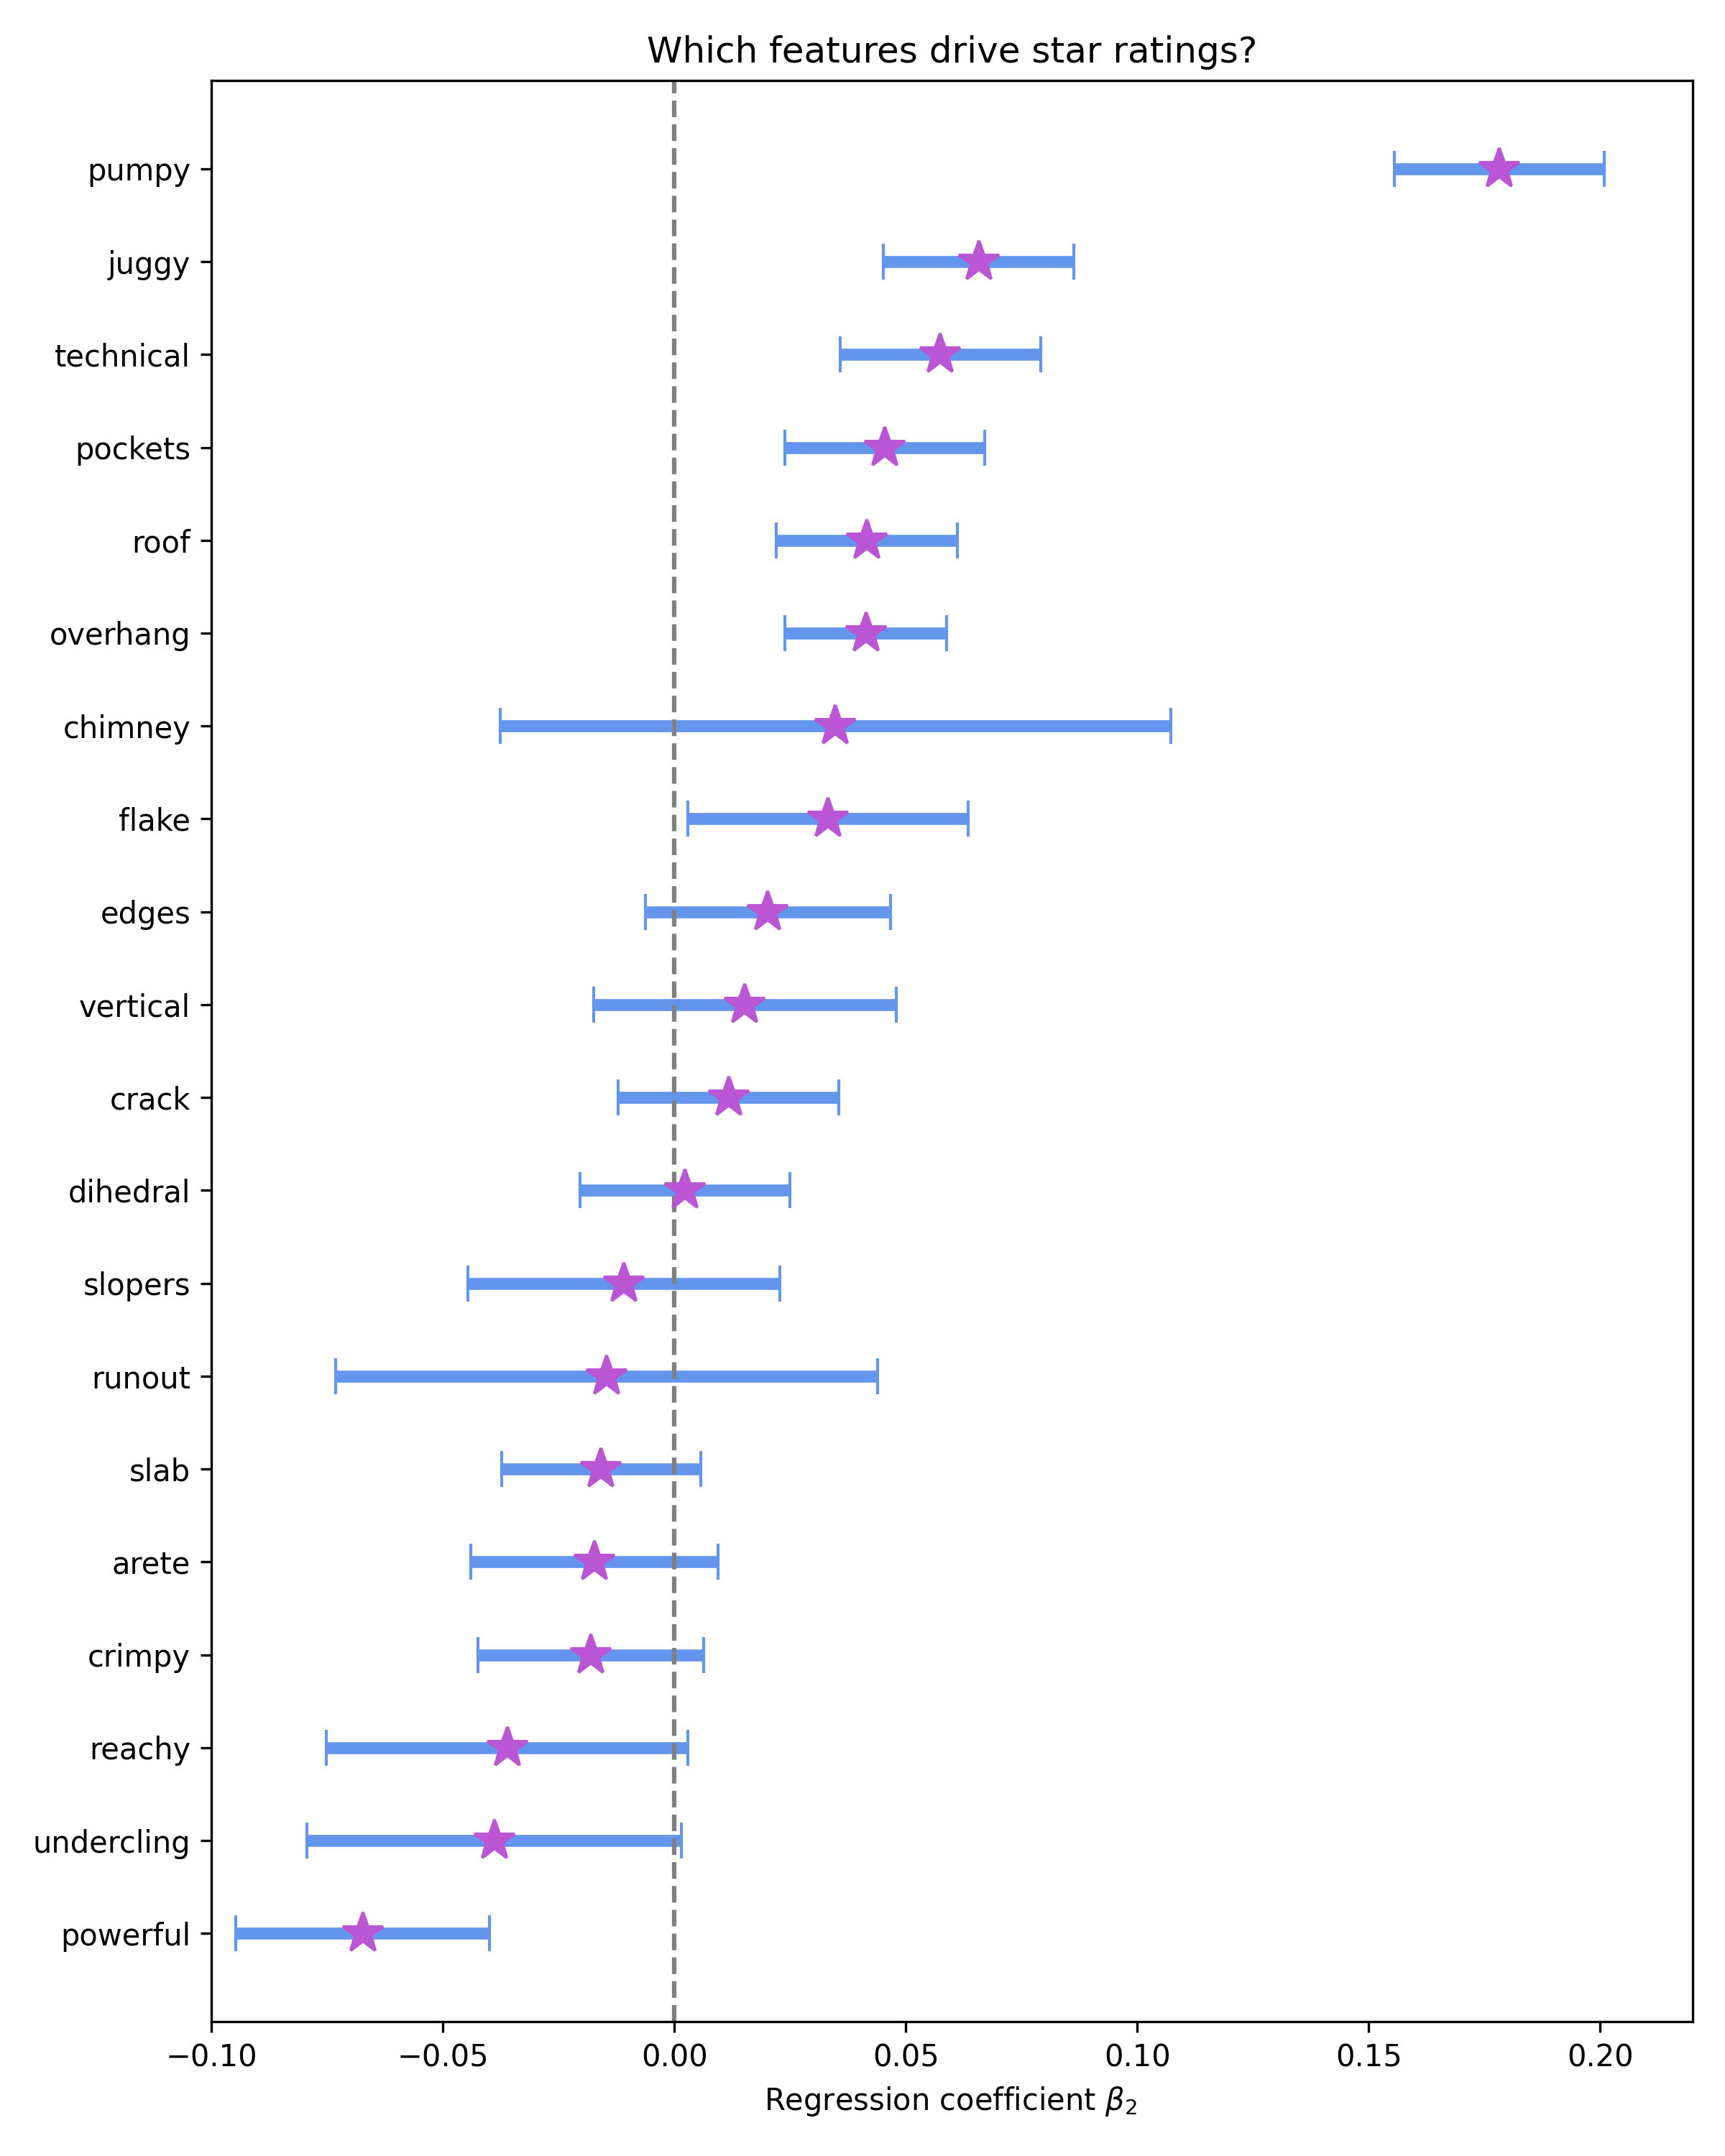
The figure below shows the estimated regression coefficients for route features that have the largest estimated effect on star ratings as purple stars, while the blue band shows the 95% confidence intervals. Positive coefficients correspond features associated with higher average star rating, while negative coefficients indicate features associated with lower ratings.
Climbs that are pumpy are strongly associated with star rating graded above 5.9, suggesting that pumpy routes are favored.
To ensure that style indicators capture distinct route characteristics rather than overlapping features (e.g., pumpy and overhang), I evaluated multicollinearity using Variance Inflation Factors (VIF). All predictors showed low VIF values (<1.3), indicating stable and interpretable coefficient estimates.